Showing posts with label Cognitive Thinking. Show all posts

Friday, 16 November 2012

Thoughts on Virginia Tech Model: Part 3

Cognitive Conflict: Piaget and Vygotsky 


The previous blog   looked at the Virginia Tech Model and how it could be extended to include cognitive conflict (defined in previous document).  The model in graphic form (Fig. 1)  was then transformed into a scattergram (Fig. 2).


Fig 1. Graphical representation of Virginia Tech model


Fig 2.  Representation of the Virginia Tech Model in terms of student ownership/engagement  against cognitive conflict.     1. The Audio/Video Tutorial Approach, 2. Personalised system of instruction, 3. Goal Based Scenarios, 4. Case Based Teaching, 5. Guided design, 6. Anchored Instruction,7. Cognitive Apprenticeship,8. Cooperative Learning,9. Constructionist Project based Models,10. Problem based Learning,11. Learning Environments

The transformation of the model into a scattergram allows a pseudo Cartesian co-ordinate plane to be established for the relationship of student ownership and cognitive conflict.  The model shown in the youtube video, mentioned by John Graves (a collaborator in the Bank Street Open Learning Community) in a
personal communication via a Google+ post ,    for the three levels of the revised Bloom’s taxonomy there are three planes of student engagement.  The first plane being the remember, understand apply.  The second plane analyse and evaluate.  The third the creative plane.  (Might need to question the correct usage of the term plane in this context).    It might be best thought of like a game of vertical chess with the student moving between the levels of Revised Bloom’s taxonomy according to the rules of the learning activity and outcome.  


The Zone of Proximal Development (ZPD) is drawn on top of  the Revised Bloom’s Taxonomy’s (RBT) plane.  The ZPD is the  shoulders, so to speak, on which the next  learning is about to stand.  After the learning and understanding the RBT planes extends to encompass the ZPD to become the what you know core.  This then acts as the starting point for the next learning activity and outcome.  This is a constructivist view of the model, and open to discussion as always.  It is also an iterative process that occurs within the overall learning objective (the “blended” use of activities that have their own learning objective to achieve the overall learning objective).  This is the intrinsic relationship between perceived micro and macro learning activities, a bit like a Russian doll.   


Key Question (IMO):     How might RBT and ZPD be represented on a Scattergram model?


Looking at the RBT model we will take 2 plane definition of Lower Order Thinking skills (LOTS) and Higher Order Thinking Skills (HOTS) as a starting point.  This is often referred to by a lot of trainers as fixed definitions.  What might be  LOTS for one group could be  HOTS for others and vice versa.  In other words the instructor needs to embrace the idea flexibilty of task to the approach to learning.  Sometimes difficult to maintain when dealing with the same group throughout  a year where curricula dictate you look at a certain knowledge area but “have to use” HOTS when the group may still be in the realms of LOTS. (But that is a different discussion for another day!).  

Looking at the Vygotsky model of ZPD we have three concentric zones (Fig 3.).   We have the core to the “apple” of what you know, the flesh (mesocarp for the botanically inclined) of the apple which is what you can learn on your own and the “skin” of the apple what you can learn with help.  The “apple” may be a good way of thinking of ZPD in terms of the amount of independent action on the part of the student.  A misshapen “apple” may be used to map the diversity of learners within a group and their relative position to others (another point possibly for development).


Fig 3.  The ZPD model, green represents prior learning (least cognitive conflict), amber represents the application of students knowledge and understanding to new challenges, red represents the greatest cognitive conflict where greater instructor or peer input is needed   
The red zone of Fig 3 is the position where I would expect the social media and collaboration to take place ie the what I can learn with help.  The relative sizes of each zone  would depend on the  learning context.  A MOOC would be more operating in the amber zone while an OLC would be in the realms of the red zone.

On a scattergram I would envisage again green, amber and red zones.  These would be arranged along the cognitive conflict continuum.  An illustrative example is shown in Fig. 4.

Fig 4.  Zones of ZPD superimposed on a Scattergram of Reworked Virginia Tech Model.  Green = What you already know, Amber = What you can learn yourself, Red = Waht you can learn with help from instructor (facilitator) and peers in a social interaction (Numbers represent learning activities from Fig. 2)

The green area extends to the line where cognitive conflict is zero since everything to the left is assumed to learnt and understood and therefore concrete.  (This is an assumption many teachers have make to their peril when trying to use cross curricular skills or a new group of students).  The amber zone is the transition achieved through independent learning using the concrete skills (green zone)  to the point where new learning understanding requires more instruction (the red zone).  As stated previously this might be through the intervention of an instructor or by the use of peer knowledge and peer instruction in an OLC.  This is why I have left activity 3 in it’s position in the 4th quadrant in the red zone
(below the axis where studentship and instructor ownership is zero or of parity between student ownership and instructor ownership).  

The learning activities (the numbers in Fig.4.) can move between the various different quadrants  as would be expected with Individual Education Plans (IEPs) or Group Learning Plans (GLPs).    The activities equally can move between green, amber and red zone.  The zones do not have be fixed on a particular line of cognitive conflict either, I will possibly discuss this in another paper.  

Comments would be appreciated.

Then next step could be to incorporate a degree of grading or using a UK term leveling on the cognitive conflict axis.


There are a lot of very complex interactions between student, instructor, context of learning activity and prior knowledge within the proposed model. Partitioning of the effects of each component and testing their impact becomes a challenge. Developing or applying standard evaluative methodologies to the steps proposed in the development of the Reworked Virginia Tech model requires some though at this time. Possibly a subject for an Open Learning Community!



Thoughts on Virginia Tech Model: Part 2


Fig 1. Graphical representation of Virginia Tech model reworked from original by pcjspalding@gmail.com.

Mapping Learning Activities

The reworking of the Virginia Tech Model  above, which I blogged  about previously  , is a starting for classifying Learning Activities by cognitive conflict. 

 Cognitive conflict is a term  defining relative demands made on learners to change or reinterpret their pre-held  concepts.  It is a type of conflict centred on completion of task.  In order to change their understanding of concepts and principles students/participants have to be involved in the learning journey.    


The above is an interpretation the Virginia Tech model and is not intended to be definitive.  The Models themselves are can be subsets of another.  For instance for  a pupil with specific learning challenges such as associated with Dyslexia the primary model may be (2) Personalised System of Instruction.  The secondary model used may (10) problem based learning.  The point I am trying to make is that they are not mutually exclusive but can be “bundled” together.

Another representation of this might be as below.


Fig 2.  Representation of the Virginia Tech Model in terms of student ownership/engagement  against cognitive conflict.     1. The Audio/Video Tutorial Approach, 2. Personalised system of instruction, 3. Goal Based Scenarios, 4. Case Based Teaching, 5. Guided design, 6. Anchored Instruction,7. Cognitive Apprenticeship,8. Cooperative Learning,9. Constructionist Project based Models,10. Problem based Learning,11. Learning Environments

The above is not, as said, a definitive model just a relative qualitative weighting of the activities compared to each other.

So how might I use this in the context of the project shared on the OFLC drive.

  1. To group Apps, tools with their most appropriate model
  2. Within the context of an Individual Learning Plan (IEP, have had to fill out many forms over the years that did not really address the aims  with Learning outcomes in a clear format) to illustrate where learners may be at in terms of independence of learning and ability to cope with cognitive conflict. Quantifying the learning task against the Learning outcome by using a leveled approach (a link here to Levels applied in UK Curriculum ICT    Could also be linked to Piaget’s or Vygotsky’s terms.
  3. To use as an aid to course to design for learning outcomes and representation of number of pupils who are achieving a level or completing a task. Individual tracking also springs to mind.
  4. Mapping the relationship between different activities in a “bundled” model of a particular learning activity/ course..


Below in Figure 3, I have sought to apply this to a Dyslexia scenario.


Fig 3.  Application of scatter chart to specific learning difficulty Dyslexia: tools considered YouTube and Kindle-book .    1. The Audio/Video/Visual Tutorial Approach, 2. Personalised system of instruction, 3. Goal Based Scenarios, 4. Case Based Teaching, 5. Guided design, 6. Anchored Instruction,7. Cognitive Apprenticeship,8. Cooperative Learning,9. Constructionist Project based Models,10. Problem based Learning,11. Learning Environments

The Virginia Tech model definition (1) (which I have slightly modified to be Audio/Video/ Visual Approach) may appear in several positions on the scatter gram Fig. 3 ( there is a more correct name but can’t recall it just at the moment).  This could be used as a graphic for the initial evaluation of where the pupil may be at and how provision for access to learning may be achieved.  The solution graphic might look something like this.


Fig 4.  Application of scatter chart to specific learning difficulty Dyslexia: tools considered YouTube and Kindle-book .    1. The Audio/Video/Visual Tutorial Approach, 2. Personalised system of instruction, 3. Goal Based Scenarios, 4. Case Based Teaching, 5. Guided design, 6. Anchored Instruction,7. Cognitive Apprenticeship,8. Cooperative Learning,9. Constructionist Project based Models,10. Problem based Learning,11. Learning Environments

In Fig 4 I have sought to demonstrate how mapping of activities to solutions might take place. A text based mode learning activity might not be the most appropriate for dyslexia at first glance.  Using the tool OpenDyslexic  (http://dyslexicfonts.com/) could be a solution,  closing the gap between learning task and accessibility.  

Mapping a learning journey may be achieved using the same framework.  This could either teacher, peer or self-assessed all that is needed is editing access to the graphic.  In Fig. 5 a theoretical journey has been shown for increasing knowledge and understanding of the Louvre Gallery in France and the Mona Lisa (general easily recognised subject).


Fig 5.  Application of scatter chart to map the learning journey for specific learning difficulty Dyslexia: tools considered YouTube and Kindle-book .   Arrows indicate potential route of the learning journey (open to change)   1. The Audio/Video/Visual Tutorial Approach, 2. Personalised system of instruction, 3. Goal Based Scenarios, 4. Case Based Teaching, 5. Guided design, 6. Anchored Instruction,7. Cognitive Apprenticeship,8. Cooperative Learning,9. Constructionist Project based Models,10. Problem based Learning,11. Learning Environments


Final bit for the thought on the model is the monitoring stage.  The timing might be over a whole  unit/course or during a year.

Fig 6.  Application of scatter chart to map the learning journey and monitoring for specific learning difficulty Dyslexia: tools considered YouTube and Kindle-book .   Arrows indicate potential route of the learning journey (open to change), red circles indicate the start and finish time for example in an academic year and not necessarily duration.    1. The Audio/Video/Visual Tutorial Approach, 2. Personalised system of instruction, 3. Goal Based Scenarios, 4. Case Based Teaching, 5. Guided design, 6. Anchored Instruction,7. Cognitive Apprenticeship,8. Cooperative Learning,9. Constructionist Project based Models,10. Problem based Learning,11. Learning Environments


The cognitive conflict the pupil undergoes during learning is a difficult quantity to measure.  Approaches of defining progression through cognitive conflict using Piagetian levels has been attempted with the use of Cognitive Accelerated Science Education (CASE).    This is not necessarily the same as the use of case based teaching alluded to in Learning Activity 4 of  the Virginia Tech Model. 

The next step will be to look at how the theories of Piaget and Vygotsky might fit into this Reworked Virginia Tech Model.


Wednesday, 14 November 2012

Can the Individual in the room please sit down?

A Personal Reflection of Trends in perception of the Learner in UK Education

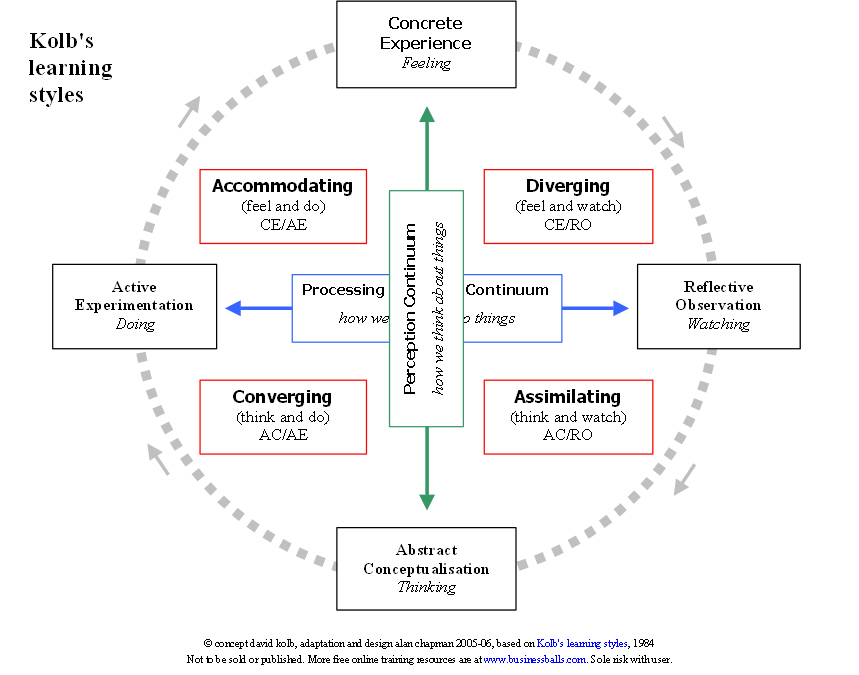
A look at the diagram to the left show's a mainstay of what has been part of British Education practice for a number of years.  The use of Learning Styles has been part of CPD in English schools through out  the drive of the implementation and improvement of the national curriculum towards individual learning. 

I have personally received many photocopied transcripts of how we should tailor individual learning plans to the student.  The idea that everybody learns differently has been an unwritten law (as opposed to theory).  Tailoring the learning process to individual perceptions of how they learn has passed into educational aspiration and often Ofsted criteria.  

A few years ago in the institution that I worked in one of the first lessons of the year in PSHE (Personal, Social and  Health Education) was to survey the pupils and decide with them which Kolb learning style they fitted into.  They were then instructed to write it down in their planner.  The grand scheme was to gather the data together at school level to inform teaching and shape individual learning experiences.  The staff were informed for a few weeks after that senior staff would be making drop-in visits to classes and asking children if they knew their individual learning styles.  Ofsted then came and went.  The effort to pursue the Individual Learning Plan along the Every Child Matters and every child is a child with special needs was somewhat lost in the mist.

The idea of Thinking skills  has been part of supportive Science teaching for a few years through CASE (Cognitive Acceleration for Science Education).  A similar project CAME has been formulated for a few years.  The basis of the work is the theories of Piaget and Vygotsky.  The CASE approach, which I have taught myself, is a set of activities teaching skills in addition to present national curriculum.  It does produce results in improving  thinking skills.  However, the difficulty in quantifying thinking skills and Piagetian levels against the framework of the national curriculum has been difficult.  The difficulty is such that time investment in  developing these critical skills is not pursued since they do not appear  to add any intrinsic to data that feeds into league tables.

The focus on thinking skills has also briefly seen an interest in Edward De Bono's Six Hats  (apprently used by the British Civil Service).  Again this was a CPD fashion at one point (along with later Emotional Intelligence) but we did need to have a bigger hat  stand at the time to be able store the new apparel. Thinking skills is still a topic kicked around on the pitch of English educational thinking.  I am trying to be neutral and to stress the benefits.  However, as has happened with the reactive nature of the way the National curriculum has developed there is never enough time to see the final result.  There appears no willingness for a second half (to continue the analogy) or the extra time goal  that makes all the effort worthwhile.  The analogy of rolling the rock to the top of the hill springs to mind. Pausing half way up for a little bird (as in a little bird told me something else) to sit atop the rock.  The rock starts to roll back down the hill with the added information.

So what has prompted this lurch through the potted history of UK educational thought in the last 15 years (yes only 15 years)?   I read an article on the BBC website reporting the Education Ministers' Michael Goves' intention to speak at a conference on Wednesday (today).  In the article we are informed that the major influence on Michael Goves' thinking comes from Dan Willingham,  a cognitive scientist.  The main thrust of his work proposes that Learning  Styles do not actually exist.  Dan Willingham's book  "Why Don't Student's Like School?" will be worth reading to see the road map for education up to 2015 and beyond.  Personally I think, he could have thought of a better title since the implication is that at the moment all pupils do not like school.  However, this does reinforce the natural English reaction to education promoted by media to a large extent.            

The reaction to the speach will be interesting to know later today.  The fact that a cognitive scientist is becoming an influence is encouraging.  How this fits with the drive to instil knowledge compared to understanding will be an interesting path to follow!

How the idea of their being no Learning Styles affects Online Learning and Open Learning Communities is an area for further exploration.